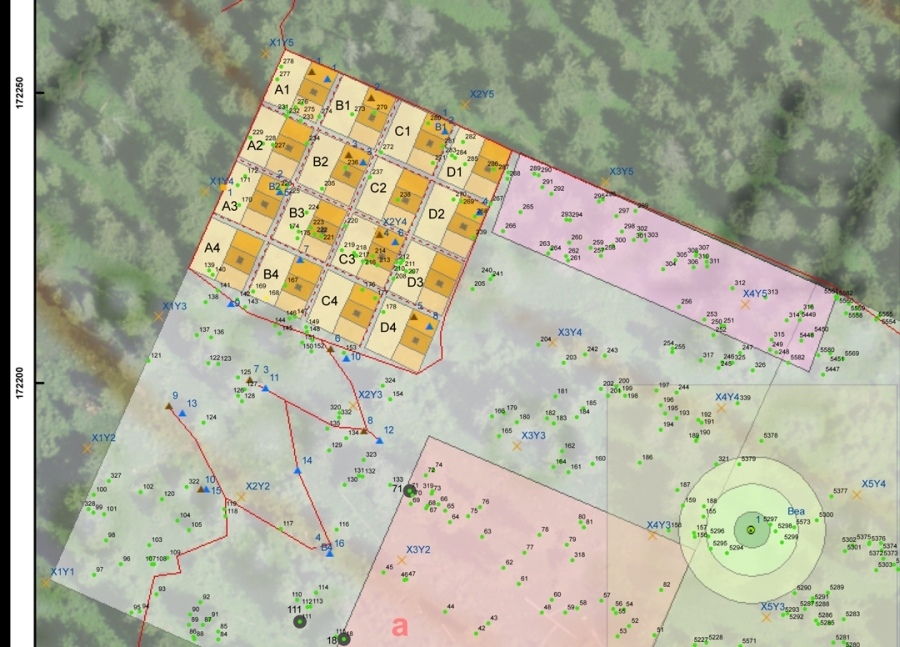
Each LWF plot usually consists of two 1-ha half-plots A and B, in which different investigation areas are delineated:
Subplots
Two square 0.25-ha subplots (a and b) are marked in each half-plot. On these subplots, we carry out the annual Sanasilva surveys (22) and measure the height and diameter at breast height (21) of all trees with a diameter of at least 5 cm.
Intensive Monitoring plot (IM)
The 43x43 m Intensive Monitoring plot (IM), which consists of 16 10x10 m partial quadrats (see below), is where we conduct most of the intensive monitoring. Some collectors are installed on these quadrats, while litterfall and throughfall collectors are also installed in a so-called “mirror plot” close to the IM plot, in order to extend the sampled area (see below, Sensors and collectors). Such a quadrat is exemplarily represented on the LWF test, training and demonstration site.
Partial quadrats
Each partial quadrat is divided into four plots:
- Soil samples are taken in the soil plot for chemical analyses.
- Rain collectors (3), snow collectors (4) and litterfall collectors (25) are installed in the deposition and litterfall plot.
- In the vegetation plot, a quadrat is marked in which we survey the ground vegetation (34).
- In the fourth plot, we investigate soil water using tensiometers (42) or lysimeters (44).
Circular vegetation plot
In the center of the LWF plot lies the center of the circular vegetation plot (30 - 500 m2), in which we carry out additional ground vegetation surveys (34).
Sensors and collectors
On the LWF demonstration site, there is only one copy of each sensor or collector, whereas several copies are usually installed on LWF sites to cover the spatial variability. For example, 16 rain collectors (3), 4 snow collectors (4) and 10 litterfall collectors (25) are installed in the IM plot and outside it.
